The global e-cigarette market crossed $46.2 billion in 2025 revenue and is now on track to exceed $78.9 billion by 2030, according to Grand View Research’s latest quarterly update released in May 2026. For US wholesale distributors and smoke store operators, understanding where that growth concentrates — and which product segments generate the highest per-unit margins — is no longer optional. It is the difference between stocking winners and sitting on dead inventory.
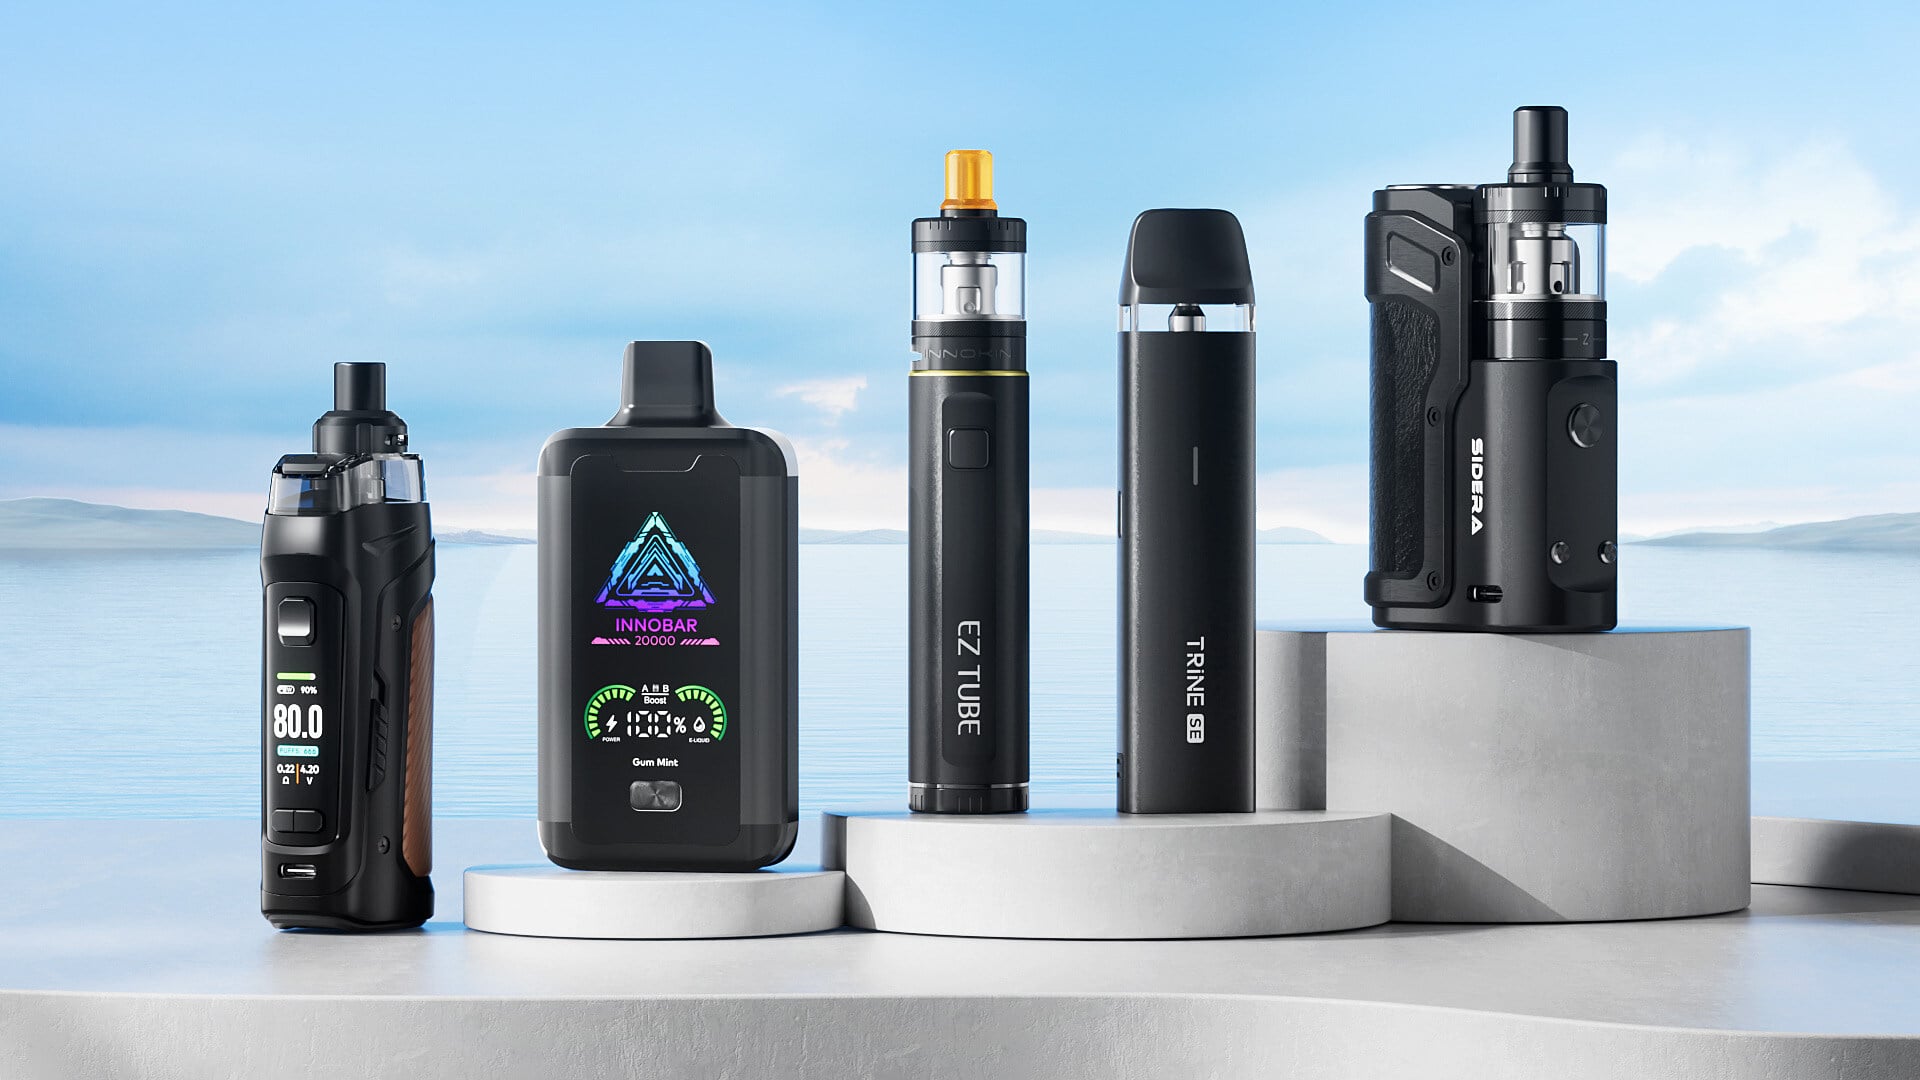
Global e-cigarette market projected to reach $78.9B by 2030 — data visualization for US wholesale distributors & bulk importers
Key Takeaways for US Distributors
- Disposable vapes now account for 61% of US vape revenue — up from 47% in2023
- Average wholesale unit cost dropped 18% YoY to $4.85 per device (8000+ puff category)
- The top 5 distributors control 34% of US B2B vape channel volume
- Pod-system resurgence is real: closed-pod revenue grew 29% QoQ in Q1 2026
- China export data shows 42% of global vape shipments now route through Southeast Asia hubs
1. Global Market Size & Growth Trajectory
Euromonitor International’s2026 Tobacco & Nicotine Database places the worldwide e-cigarette and heated tobacco market at $46.2 billion for2025, representing a compound annual growth rate (CAGR) of 11.8% from the2020 baseline of $26.4 billion. The firm projects the market will reach $78.9 billion by 2030, driven primarily by three forces: regulatory normalization in key European markets, the disposable vape explosion in North America, and rising adoption across Southeast Asia and the Middle East.
Within that headline figure, the disposable vape segment alone generated $28.2 billion in 2025 global revenue — a 39% increase year-over-year. The United States remains the single largest national market, accounting for $14.8 billion or roughly 32% of global vape spending.
| Metric | 2023 | 2024 | 2025 | 2026 (Est.) | 2030 (Proj.) |
|---|---|---|---|---|---|
| Global Market Size | $33.1B | $39.6B | $46.2B | $52.8B | $78.9B |
| US Market Size | $10.2B | $12.6B | $14.8B | $16.9B | $24.3B |
| Disposable Segment (Global) | $14.8B | $20.3B | $28.2B | $34.1B | $48.7B |
| CAGR (Global) | — | 12.1% | 11.8% | 11.4% | 10.9% |
| US Share of Global | 30.8% | 31.8% | 32.0% | 32.0% | 30.8% |
2. US Wholesale Channel Breakdown
For distributors operating in the B2B vape supply chain, the channel mix tells a more actionable story than the top-line market size. Nielsen’s US C-store and tobacco outlet scan data (52 weeks ending April 2026) shows disposable vapes commanding 61.3% of all vape category sales by dollar volume in brick-and-mortar retail. Pod-based systems — led by JUUL, Vuse, and NJOY — account for 22.1%, while refillable/open-system devices capture the remaining 16.6%.
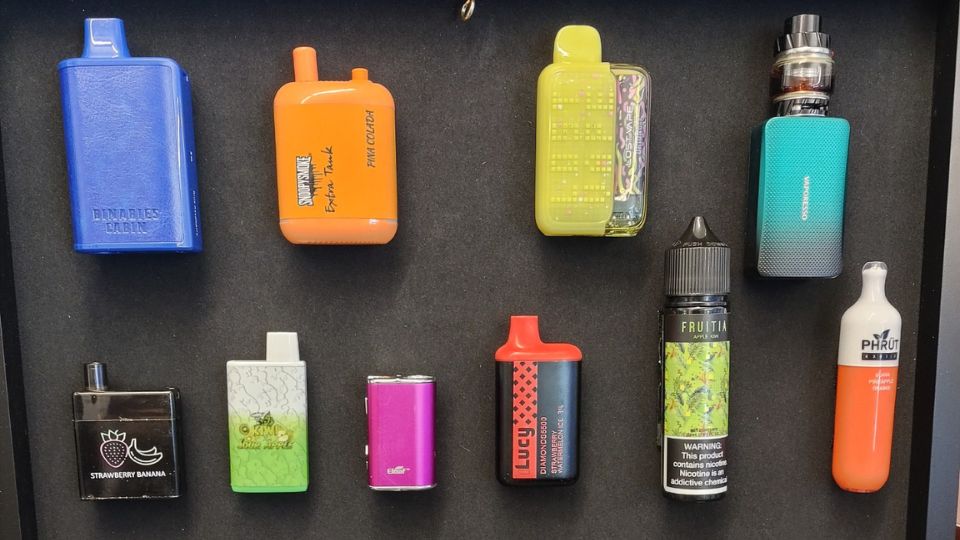
US wholesale vape channel mix 2026: disposable devices dominate at 61.3% of total category revenue across retail outlets
Within the disposable segment, the 8000–15000 puff tier has become the sweet spot for wholesale buyers. Unit economics in this range offer the best combination of retail price elasticity and landed cost control. According to VapeBusiness Analytics, the average wholesale price for an 8000-puff disposable in Q1 2026 was $4.85, down from $5.92 a year earlier — an 18% decline driven by intensified Chinese manufacturer competition and oversupply.
| Puff Count Tier | Avg. Wholesale Price | Avg. Retail Price | Gross Margin | Turnover Rate |
|---|---|---|---|---|
| 3000–5000 puffs | $3.20 | $12.99 | 75.4% | 2.1x / month |
| 5000–8000 puffs | $4.15 | $16.99 | 75.6% | 2.8x / month |
| 8000–15000 puffs | $4.85 | $19.99 | 75.7% | 3.4x / month |
| 15000+ puffs | $6.40 | $24.99 | 74.4% | 1.9x / month |
“The8000-to-15000-puff bracket is where we see the highest velocity for distributors. Consumers perceive premium value, retailers enjoy 75%+ margins, and the landed cost from Shenzhen manufacturers has dropped below $5 for the first time. It is the single best category to build a wholesale portfolio around in 2026.”
— Marcus Chen, Senior Analyst, Euromonitor Tobacco & Nicotine Practice
3. Regional Revenue Distribution
The United States remains the dominant national market, but regional growth rates are shifting. The Asia-Pacific region — driven by Japan’s HTP adoption, Australia’s prescription-only model creating a gray market, and India’s emerging vape sector — grew 16.2% YoY in 2025, outpacing North America’s11.4% growth rate.
Europe presents a fragmented picture. The UK, despite its proposed disposable ban under the Tobacco & Vapes Bill, saw vape revenue actually increase 8.3% in 2025 as consumers shifted to higher-value rechargeable disposable hybrids. Germany and France posted modest5–7% growth under TPD III preparation, while Southern European markets (Italy, Spain) showed surprising acceleration at 12–14% as enforcement gaps created opportunity for non-compliant products.
| Region | 2025 Revenue | YoY Growth | 2030 Projection | Key Driver |
|---|---|---|---|---|
| North America | $16.1B | 11.4% | $26.2B | Disposable vape dominance |
| Europe | $12.8B | 7.9% | $19.4B | Pod-system transition |
| Asia-Pacific | $10.9B | 16.2% | $22.1B | HTP + gray market growth |
| Middle East & Africa | $3.8B | 18.7% | $6.9B | Regulatory liberalization |
| Latin America | $2.6B | 14.3% | $4.3B | Youth adoption + low base |

Regional revenue distribution for global e-cigarette market — Asia-Pacific growth rate now leads North America by 4.8 percentage points
4. Manufacturer & Brand Market Share
The competitive landscape at the manufacturing level continues to consolidate around Shenzhen-based producers. Smoore International (the parent of FEELM technology and CCELL cartridges) reported $2.18 billion in H1 2026 revenue, maintaining its position as the world’s largest vape OEM. RLX Technology, despite ongoing China domestic market headwinds, posted $890 million in Q1 2026 revenue — a 12% QoQ recovery.
On the brand side, the US disposable vape market is now a three-tier structure:
- Tier 1 — Mega Brands ($500M+ US annual revenue): Elf Bar/EB Design, Lost Mary, Geek Bar, Flum
- Tier 2 — Growth Brands ($100M–$500M): Raz, Fume, Breeze, Hyde, Pod Juice
- Tier 3 — Emerging/Niche ($10M–$100M): 300+ brands competing for remaining market share
The Tier 3 segment is where most US distributors find their margin advantage. While mega brands offer volume consistency, the long-tail brands frequently provide 15–25% better wholesale pricing and more flexible MOQ terms. The key risk is FDA enforcement — brands without PMTA submissions face potential market exit, which could strand distributor inventory.
| Brand Tier | # of Brands | US Revenue Share | Avg. Wholesale Margin | FDA Risk Level |
|---|---|---|---|---|
| Tier 1 (Mega) | 4–6 | 42% | 18–22% | Low (PMTA filed) |
| Tier 2 (Growth) | 15–20 | 31% | 22–28% | Medium |
| Tier 3 (Emerging) | 300+ | 27% | 28–35% | High |
“Diversifying across brand tiers is the smartest risk-adjusted strategy for distributors right now. Allocate 50% to Tier 1 for stability, 30% to Tier 2 for growth, and 20% to Tier 3 for margin capture — but only after verifying PMTA filing status on every SKU.”
— Jennifer Park, CFO, VapeOne Distribution (California)
5. Investment & M&A Activity
Capital flows into the vape sector tell a story of maturation. Global vape-related M&A deal volume reached $3.4 billion in2025, according to PitchBook data. The most notable transactions included Altria Group’s continued expansion of its NJOY portfolio, British American Tobacco’s acquisition of a Southeast Asian distribution network for $420 million, and a cluster of private equity deals targeting US-based multi-state distributor rollups.
For wholesale operators, the M&A wave has a direct operational impact: consolidated distributors are negotiating 8–12% volume rebates from manufacturers, creating margin pressure for independent operators. The counter-strategy is specialization — independents who focus on specific regional markets, product niches (e.g., nicotine-free disposables, CBD vape, luxury pod systems), or value-added services (custom labeling, state compliance consulting) consistently outperform generalist competitors.

Vape industry M&A activity reached $3.4B in 2025 — US wholesale distributors face consolidation pressure requiring strategic positioning
6. China Export Data & Supply Chain Signals
China Customs data for January–May 2026 shows total e-cigarette exports of $5.82 billion, a 14.6% increase over the same period in 2025. Shenzhen remains the production epicenter, but the logistics routing has shifted significantly:
| Export Route | % of Total Volume | YoY Change | Avg. Transit Time |
|---|---|---|---|
| Shenzhen → US Direct | 38% | -6.2% | 22–28 days |
| Shenzhen → Vietnam → US | 18% | +4.1% | 32–38 days |
| Shenzhen → Malaysia → US | 12% | +3.8% | 35–42 days |
| Shenzhen → EU Direct | 24% | +1.2% | 28–35 days |
| Other Routes | 8% | -2.9% | Variable |
The Southeast Asia rerouting trend is driven by two factors: US Section 301 tariff avoidance (the 35% tariff on direct Chinese vape imports remains in effect) and manufacturer hedging against potential future trade restrictions. For US distributors, this means landed cost calculations must now account for multi-hop logistics — adding an estimated $0.30–$0.55 per unit for transit-routed shipments.
7. What This Means for Your2026 Buying Strategy
Data without action is just noise. Here is how US wholesale distributors should translate these market signals into purchasing decisions:
- Portfolio rebalancing: Shift60% of buying volume to the 8000–15000 puff tier. This segment offers the optimal margin-velocity combination and is where Chinese manufacturers are competing hardest on price.
- Brand diversification: Maintain relationships with 2–3 Tier 1 brands for baseline volume, but build 5–8 Tier 2 partnerships for margin uplift. Verify PMTA status before committing to Tier 3 brands.
- Supply chain hedging: If your primary supplier ships direct from Shenzhen, develop a secondary supplier using Vietnam or Malaysia routing. The3–5% cost increase is insurance against tariff escalation.
- Inventory cadence: With unit costs declining 18% YoY, resist the urge to over-buy at current prices. Place smaller, more frequent orders (monthly vs. quarterly) to benefit from continued deflation.
- Regional expansion: The Middle East and Latin America are growing at 14–19% annually. If you have export capability, these markets offer higher per-unit margins than the saturated US domestic channel.
8. Looking Ahead: H2 2026 & Beyond
Several catalysts could reshape the data landscape in the coming quarters:
- FDA PMTA enforcement escalation: The agency issued 623 warning letters in H1 2026 alone. If follow-up import alerts materialize, the Tier 3 brand population could shrink by 30–40%, consolidating volume into Tier 1/2 players.
- EU TPD III implementation (July 2026): Flavor bans and traceability requirements will immediately impact European order patterns, potentially redirecting Chinese export volume toward US and Middle Eastern buyers.
- US state-level flavor bans: California, Massachusetts, and New Jersey have active or pending restrictions. Distributors operating in these states should model 15–25% revenue impact scenarios.
- Technology disruption: Dual-mesh coil, smart-temperature, and rechargeable hybrid devices are gaining traction. These higher-ASP products could shift wholesale economics in2027.
“The data is clear: the vape market is not slowing down, but it is fragmenting. Distributors who treat this as a single-category play will miss the nuanced growth pockets emerging across puff tiers, brand tiers, and geographies. The winners in2026 are the ones building data-driven procurement models, not just placing orders based on last year’s bestseller.”
— David Liang, Managing Partner, Shenzhen Vape Export Association

The future of vape wholesale belongs to data-driven distributors — market intelligence and strategic procurement define2026 competitive advantage
The global vape industry is entering a phase where scale alone no longer guarantees competitive advantage. US wholesale distributors who invest in market intelligence — tracking manufacturer pricing trends, regulatory shifts, and channel-level sell-through data — will consistently outperform those relying on intuition and legacy supplier relationships. The numbers do not lie: the market is growing, but the growth is unevenly distributed. Your job as a distributor is to follow the data.
For a custom market analysis tailored to your distribution territory, product mix, and margin targets, contact our wholesale team to schedule a data consultation. View our full wholesale catalog and bulk pricing for current inventory availability.
US distributor data analysis
wholesale vape pricing
disposable vape trends
bulk buying guide
e-cigarette market report
vape industry forecast
China vape exports
smoke store margins
vape M&A activity